

Quarterly market commentary - September 2025
Global share markets continued to march higher during the third quarter of the year, contributing to strong returns for most diversified investors.
Markets were driven by several intersecting themes, including the interest rate easing expectations of central banks, a continuation of positive sentiment towards AI-related businesses, and intermittent political/regulatory risks.
By September, the US Federal Reserve delivered its first 0.25% cut to US interest rates in this cycle (opening a path for further reductions), which pushed global bond yields lower and lifted bond prices. This also contributed to increased volatility as markets debated the timing and depth of future rate cuts.
Information technology and communication services were the leading US equity sectors for the quarter, driven by strong returns from high-profile mega cap companies like the microchip behemoth Nvidia and Google’s parent company, Alphabet.
Political and regulatory ‘noise’ included a US government funding impasse and ongoing geopolitical tensions which, on headline days, served to boost demand for safe-haven assets while trimming broader risk appetites.
However, despite a backdrop of slower growth and ongoing trade/tariff uncertainties, investors who weathered the volatility and stayed invested were generally well rewarded.
Recency bias
The last few years have been noteworthy for the strong returns coming from a few mega cap firms in the US share market (such as Nvidia, Microsoft and Apple). With financial commentators devoting more and more column inches to these large and high profile firms, investors could be forgiven for thinking they are the only firms that matter. Unfortunately, that creates a breeding ground for a condition known as ‘recency bias’.
This is a cognitive bias that favours recent events over historic ones. It often manifests when we identify what appear to be strong price trends (either up or down) in selected companies, or an entire market, often over the short term. It convinces us that rising prices will continue to appreciate, or that declining prices are likely to keep falling.
Recency bias often leads us to make emotionally charged choices – such as holding shares for too long (when prices have risen), or selling out too soon (when prices have fallen). These kinds of decisions may feel right at the time, but often end up eroding our long-term investment performance.
To provide some context around this, the chart below shows the cumulative return of two different US share indexes going back to the beginning of 1994 – the S&P 500 (Large cap index, in purple) and the S&P SmallCap 600 (Small cap index, in orange)[1].
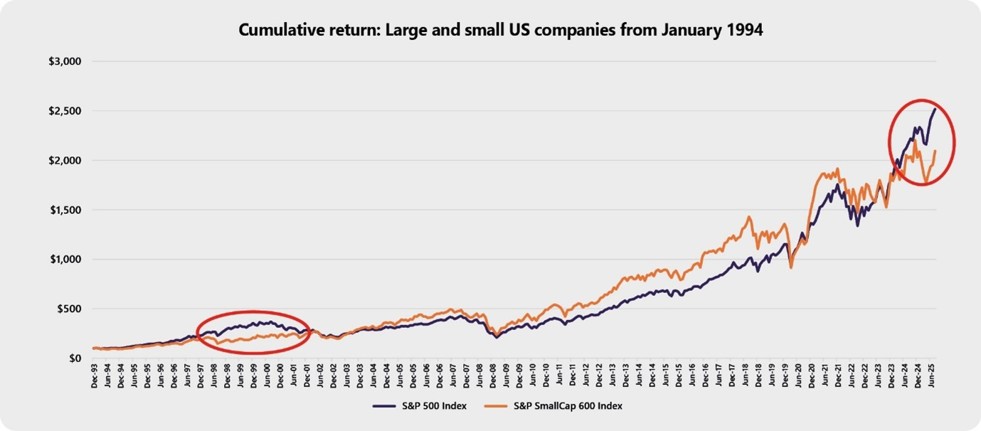
It might come as a surprise to see that, apart from the two periods highlighted in red, the cumulative return of small US companies has generally been superior to large US companies (including the high-profile mega cap companies referred to earlier).
The first highlighted period, starting in the late 1990s, was the tail-end of the now infamous dot.com bubble, where many large firms became significantly overvalued on the idea that the internet was going to change the world.
The internet did change the world, but many unrealistic company valuations went from sky-high to cents in the dollar (or in some cases to zero) as investors eventually returned to fundamental valuation metrics linked to sales revenue, growth and profits.
The second highlighted period is the last three years where a cohort of mega cap companies have outperformed the wider market, spurred along by further advances in technology and, in particular, developments in artificial intelligence (AI).
This is not a prediction that AI related businesses today are about to suddenly underperform as they did following the dot.com crash. It is simply a reminder that the recent outperformance of the large cap segment of the US market is far from the norm that our recency-biased minds might have assumed.
New Zealand economy poised for better
In August, the Reserve Bank of New Zealand (RBNZ) cut the Official Cash Rate (OCR) by 0.25% to 3.00% and followed this with a further 0.50% cut to 2.50% on 8 October, marking a low not seen in more than three years.
While global uncertainty was a contributing factor, the RBNZ noted across the two announcements that growth in the New Zealand economy had stalled, with cautious behaviour by households and businesses being mirrored by a soft labour market.
This is evidenced in the chart below showing the New Zealand growth rate (measured by annual Gross Domestic Product) and our associated unemployment rate over the last 20 years. It tells an interesting story.
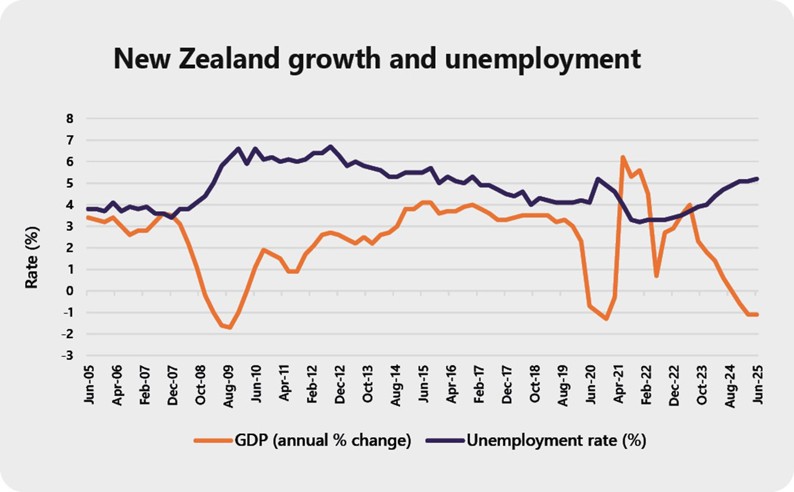
Twenty years ago, economic growth in New Zealand was fairly steady at around 3% and unemployment was low at just under 4%. Then, without much warning, we were confronted with the Global Financial Crisis (GFC) in 2008/2009 and, as per the chart, its impact on New Zealand’s growth and unemployment is unmistakeable.
The GFC triggered the deepest global downturn since the 1930’s. Economies contracted, international trade declined and millions of people around the world lost their jobs. New Zealand was not immune from these shockwaves. Over the 2008/2009 period, our unemployment rate increased to near 7% and our growth rate plummeted, with the economy contracting close to -2% in the year to 30 September 2009.
After spending the next 10 or 11 years gradually improving our economic growth and with unemployment easing back down to 4% again, in early 2020 the world was confronted with another unforeseen crisis – this one called Covid-19.
And look at what happened. Growth in New Zealand has been highly unstable ever since. This was initially due to lockdowns and border closures, and more recently due to our struggle to adapt to the much higher interest rates that were implemented after inflation spiked to levels not seen since the 1980’s. In the midst of a more difficult growth environment, New Zealand’s unemployment rate also moved back above 5%.
While the economy is struggling to get back to a more sustainable growth track, lower interest rates offer some hope that the headwinds facing local businesses may be starting to ease.
Since July 2024, the OCR has fallen from 5.5% to 2.5%, and in its 8 October announcement the RBNZ indicated it remains open to further reductions in future if conditions require it. At these much lower levels, we can reasonably expect lower financing costs to be a boost to New Zealand business activity, which would eventually flow through into higher growth and lower unemployment.
While the economy has faced a few challenging years since the arrival of Covid, the outlook ahead looks rather more positive.
The Trump tariffs – what’s new?
It's too big a topic to write about in detail, but it’s also too important to ignore.
One of the key policy issues hanging over markets continues to be the uncertain rollout of tariffs by the US. Although details remain fluid, it seems clear that the US is currently committed to adopting more aggressive trade protectionism. Their preferred approach has been to impose higher baseline tariffs, expanding country-specific tariffs, and reducing prior exemptions (such as the former de minimis rule that exempted tariffs on parcels worth less than USD 800).
Adding to the confusion is that tariffs are not just being spruiked for trade or economic protection reasons. They have also been trumpeted to as tool for promoting national security, greater border control, and even as a bargaining chip in geopolitical negotiations. While there isn’t much historical evidence supporting some of these claims, that’s not slowing down the Trump administration, who are relentlessly pressing ahead with its strategy.
However, regardless of the rationale, tariffs are slowly starting to result in increased costs for US supply chains and consumers, and some US industries are warning that higher input costs and inflation will lead to reduced competitiveness.
This tug-of-war between the tariff virtues being extolled by the Trump administration versus the real-world impact on consumer prices and supply chains may become a central issue in the run-up to the 2026 US mid-term elections on 3 November. If, by then, US consumers are still not seeing or feeling the benefits of these policies, there will be an opportunity for them to record their frustration at the ballot box.
The other fascinating aspect of this is that, on 30 August, a US appeals court ruled that most of the tariffs were illegal. Regardless, they allowed the tariffs to remain in place to give the Trump administration a chance to appeal to the US Supreme Court. The Supreme Court has subsequently granted a review and is scheduled to hear arguments in November
As the centrepiece of the Trump administration’s entire economic policy agenda, this appeal will be watched intently around the globe, where questions about the legality of the tariffs and the degree of independence of the US Supreme Court, will potentially all be answered at once.
The pros and cons of safe haven assets
A safe haven asset is an investment that investors are attracted to during times of market stress, or crisis, because it is expected to hold its value or even increase in value while riskier assets (like shares) might fall.
Key characteristics of such assets are:
- They are easily understood and not reliant on a single market
- Their value is stable or declines far less than other assets in downturns
- They are easy to sell, even in stressed markets
The ultimate safe haven asset is probably cash, at least for short periods, as it is a very low risk asset and doesn’t move in harmony with other assets. However, holding cash for long periods introduces an exposure to inflation risk.
Another traditional safe haven asset is US Treasury bonds or the US dollar. Often, when investors have sought shelter from stressed share markets, bonds issued by the US government are almost always highly sought after, due to the US’s strong credit worthiness and the US dollar’s role as global reserve currency.
The other safe haven asset that most people think of is gold. Its supply is limited, it’s globally accepted and its value is not tied to any government.
The problem with safe haven assets is not so much knowing what they are, it’s thinking that we can usefully time our entry into and out of them.
Buying a safe haven asset when times are tough is more likely to be a bad idea than a good one. Often a trade like this is considered when markets have already fallen to the point that investors don’t feel they can tolerate staying invested any longer. Unfortunately, that frequently results in investors selling assets at a discount (i.e. when their expected future returns have risen significantly).
Then, in order to one day leave the safe haven asset and move back into risky assets, investors who were spooked on the way down are likely to want to see clear evidence that the markets are recovering. And, you guessed it, that tends to result in investors buying assets back after their prices have already gone up.
The aggregate effect is that an investor is likely to be worse off than if they had simply held on to their well-diversified portfolio of risky assets in the first place.
Investors also need to be aware that, in spite of their name, safe haven assets aren’t always true to label and can also experience a decline in value for periods of time. Sometimes that can even coincide with the stressed market conditions that investors are seeking to avoid.
With many share markets currently cresting all-time highs, safe haven assets aren’t getting much media attention. However, when that inevitably changes sometime in the future, just remember that sticking to a well-diversified, long term plan is quite often the best decision of all.
Final thoughts
If someone was able to tell you that over the next 20 years global shares would go up in over 75% of calendar quarters (three-monthly blocks) while delivering a compound annual return of 9.7%pa over the full period, your response should be only four words – “where do I sign?!”.
What’s notable about those numbers is that this has been the actual performance of global shares hedged to the NZ dollar over the last 20 years despite recessions, geopolitical conflict, wars, a global financial crisis and a global pandemic. That should say something reassuring about the propensity for innovation, risk taking and capitalism to be extremely well rewarded over long time periods.
And, as shares form the growth engine of most traditional long term investment plans, that level of return goes a long way to helping all investors achieve their long term planning goals.
Unforeseen life changes will inevitably occur, so adapting a plan to new information is always a good idea. But, otherwise, less is more. Maintaining good disciplines, avoiding investment fads, and resisting behavioural urges to take more (or less) risk as market conditions change, will all help propel you to your desired investment destination.
We don’t know what the future holds, but we can know with certainty that the next 20 years will be full of news that we didn’t expect. Some of it is likely to genuinely concern us when it happens. However, as in the last 20 years, we have every reason to expect that markets and patient investors will continue to win out in the end.
[1] Within the largest 1,500 companies in the US, the S&P 500 captures the returns of the 500 largest firms, while the S&P SmallCap 600 captures the returns of firms ranked 901 to 1,500, by size.
Click here to view the full newsletter in PDF
For a detailed review of the asset class performances for the quarter, see ‘Key market movements - September 2025’
Disclaimer
While every care has been taken in the preparation of this newsletter, Consilium makes no representation or warranty as to the accuracy or completeness of the information contained in it and does not accept any liability for reliance on it. Information contained in this newsletter does not constitute personalised financial advice and does not take into account your individual circumstances or objectives.
-

Key market movements - September 2025
The third quarter of 2025 delivered exceptional returns across the board, with progress on US trade deals, ongoing strength in the technology sector and accommodative monetary policy being the key factors driving risk-on sentiment around the world.
-

The case for working beyond retirement age
Retirement no longer means what it used to. As more people work into their 60s, 70s and beyond, it’s time to rethink what this life stage really looks like for you.